Few weather stations in the north

There are only a few weather stations in the north of Ontario and many have only been recording temperature for the past 30 years. In the northern Ontario, only four weather stations have long temperature records: Big Trout Lake, Landsdowne House, Moose Factory and Pickle Lake.
The Big Trout Lake Climate Story
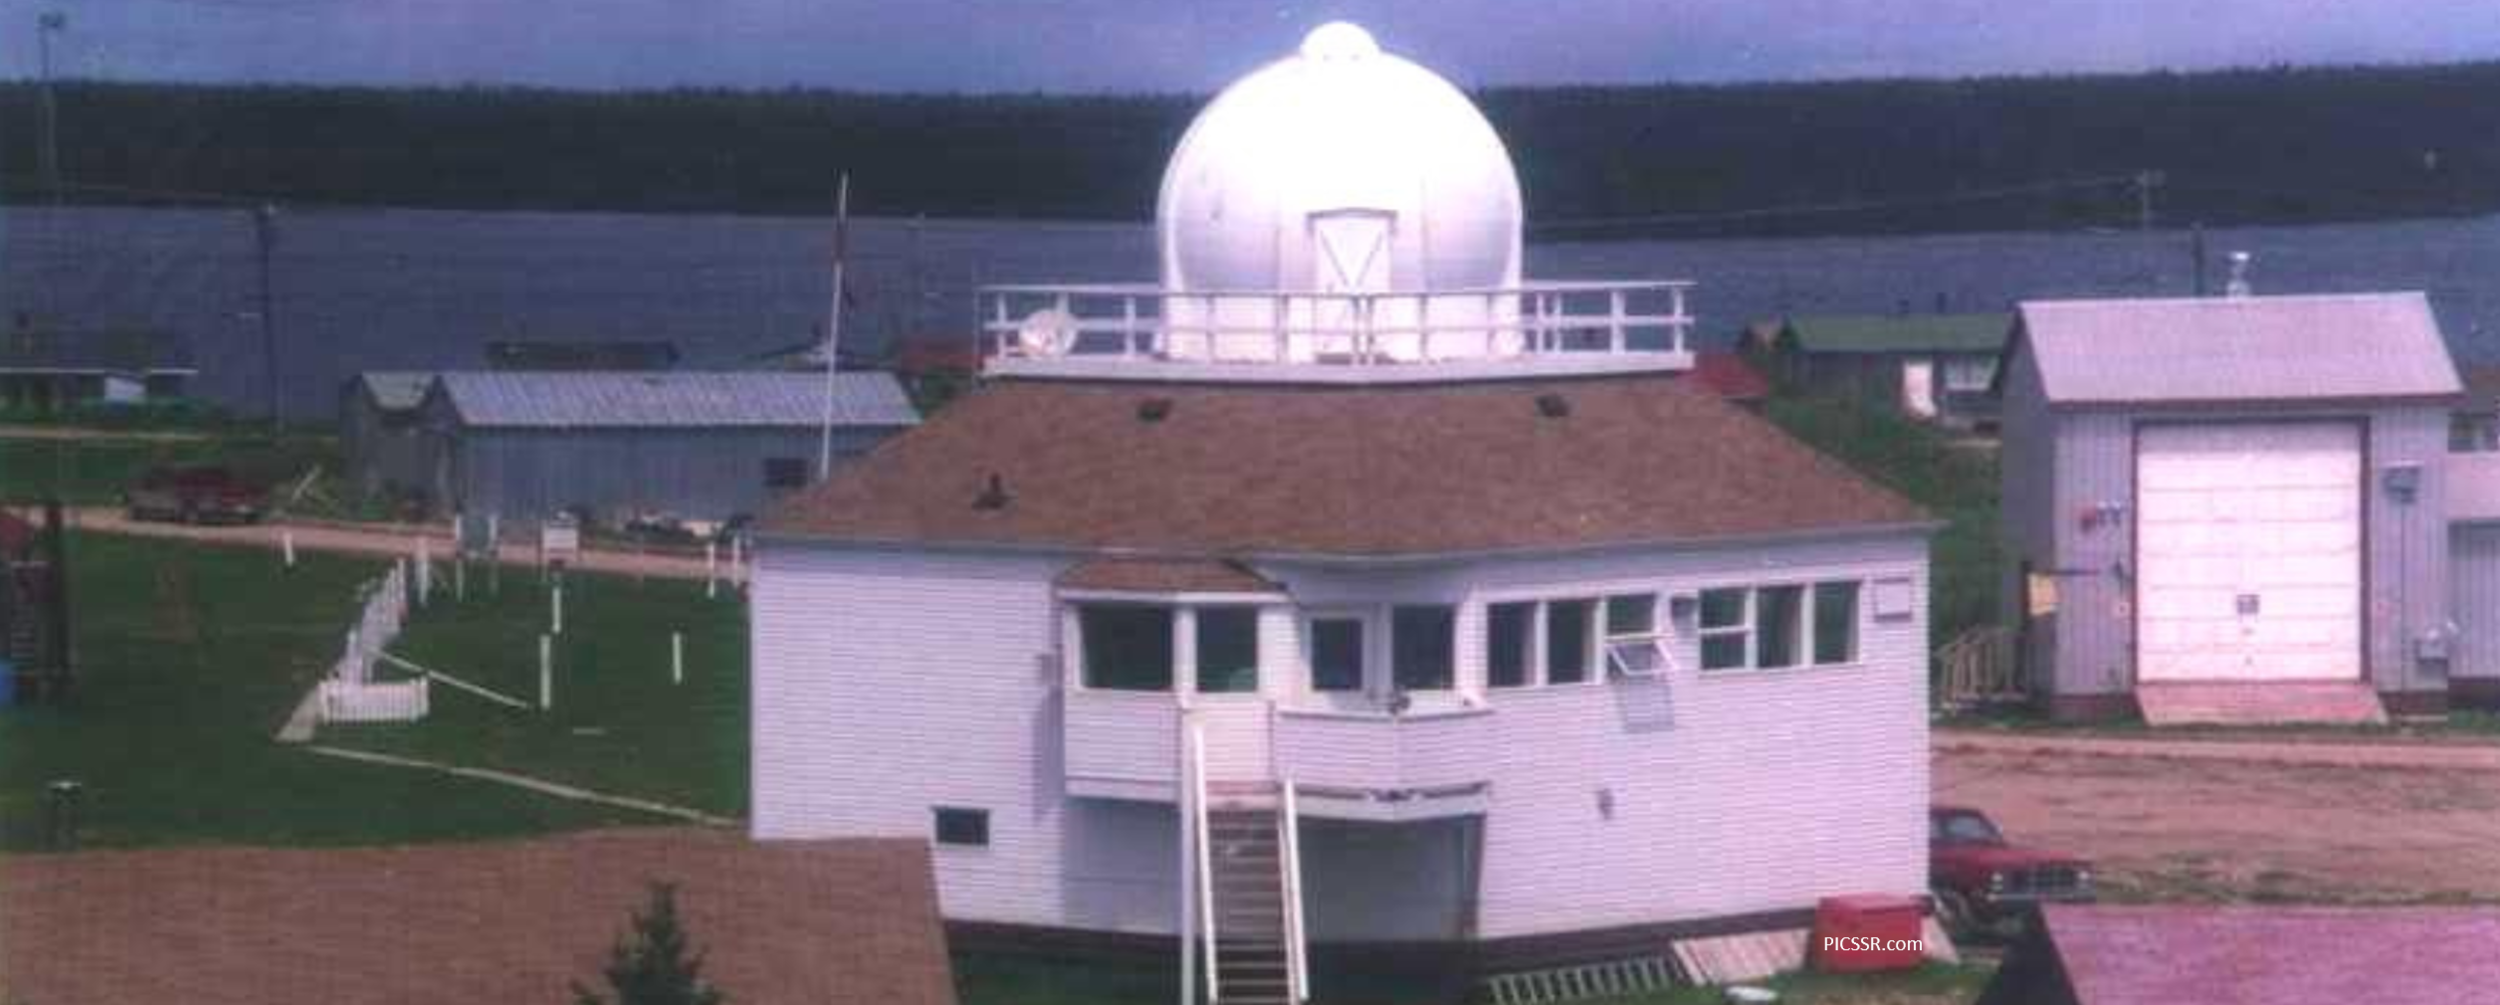
There are not many weather stations in northern Ontario but one weather station near Big Trout Lake, Ontario has been collecting temperature, rain, and snow information since the early 1940s. This is one of the largest collections of weather information from Environment Canada in the far north of Ontario and is used to understand changes in climate for many First Nation communities in the surrounding areas. We use Big Trout Lake as an example below of what changes have occurred to the climate up north over a lifetime. This information can help us understand how the weather has changed over time and predict how it may change into the future.

Weekly temperatures in Big Trout Lake, Ontario have gotten warmer since the 1980s, as shown in the animated circle at left.
Yellow bars show warmer temperatures than average over each week, while grey bars show colder than average temperatures over each week. The longer the bar, the bigger the difference in temperature.
Looking at this graphic, you can see the colour of the bars not only change to yellow (hotter weekly temperatures) but the bars also get larger into the 2010s.
Temperature has increased in all seasons in the north since 1980, especially in winter. Records from the monitoring station in Big Trout Lake show the changes very clearly.
There are more hot summer days than there were a lifetime ago

A lifetime ago, Big Trout Lake, Ontario had about 13 days per summer above 25°C.
In the 1980s, there were on average 16 days per summer above 25°C.
More recently, this same area is seeing about 22 days (almost a month) of days above 25°C per summer!
In the graph above, the red line shows the average number of days above 25°C per year in Big Trout Lake, Ontario from the 1940s until 2016.
The grey lines are the actual number of days above 25°C in each year.
The red line averages each of the year to show a trend of increasing number of hot days at Big Trout Lake.
In Big Trout Lake, there are also fewer cold days than there were in the 1980s
Frost days (minimum daily temperature of less than 0°C) have reduced by a week.
Ice days (maximum temperature in a day of less than 0°C) have reduced by 20 days (almost a month!)
Days of extreme cold (-40°C or below) have decreased by 2 days.
Cold spell days (6 consecutive days with a minimum temperature of -20°C or lower) have decreased by 8 days.
The frost-free season has been reduced by 3 days and starts 3 days later than it did in the 1980s.
Other northern weather station show similar trends of increase in temperature

Weekly temperature changes for each of the northern Ontario weather stations are showing similar trends to the Big Trout story. Weeks are getting warmer.
Some weather stations have temperature data that begins in while others like Moose Factory has records as far back as the 1890s.
The average weekly temperature in each decade were calculated and compared to the average for 1951-1979. The bars represent the average temperature change, in degree Celsius, for a week compared to the temperature of that week between 1951-1979. The longer the bar, the more the temperature has changed. Yellow bars show warmer temperatures for that week and the blue bars show colder temperatures for that week.
